What's working. What's leaking.
Trusted by leading agencies and brands
From boutique agencies to global powerhouses managing thousands of campaigns.















Five answers native networks leave out.
Uptime, pacing, rank, health, drift. One diagnostic surface across every connected network, and every gap gets a number.
Uptime, measured
Live ad uptime per ad object across every network. Dark periods surface as recoverable impressions and missed GMV, the metric native agents are blind to.
Pacing you can steer
Spend pacing projected against live outcomes, with what-if levers redrawn in real time. Budget decisions happen with the curve in front of you.
Rank against rivals you pick
Native networks will not name your competition. You name them, and rank is mapped on every keyword, chart, and feed you watch.
Health, diagnosed
Auction pressure, auto-ads behavior, audience saturation, budget utilization, and creative freshness. When performance dips, you see why, not just that.
Drift, in dollars
GMV lost to downtime, overspend on weak placements, pacing misses, and bid drift are quantified in currency. You know what underperformance costs before it compounds.
Intraday, not next-day
Hourly performance across networks in one cockpit. You catch a dark period or a runaway trend today, not in a next-day report.
One platform every paid surface.
connected
maintained
per operator
coverage
accuracy
recovered
Five answers, live everywhere.
Across every connected network, all the time.
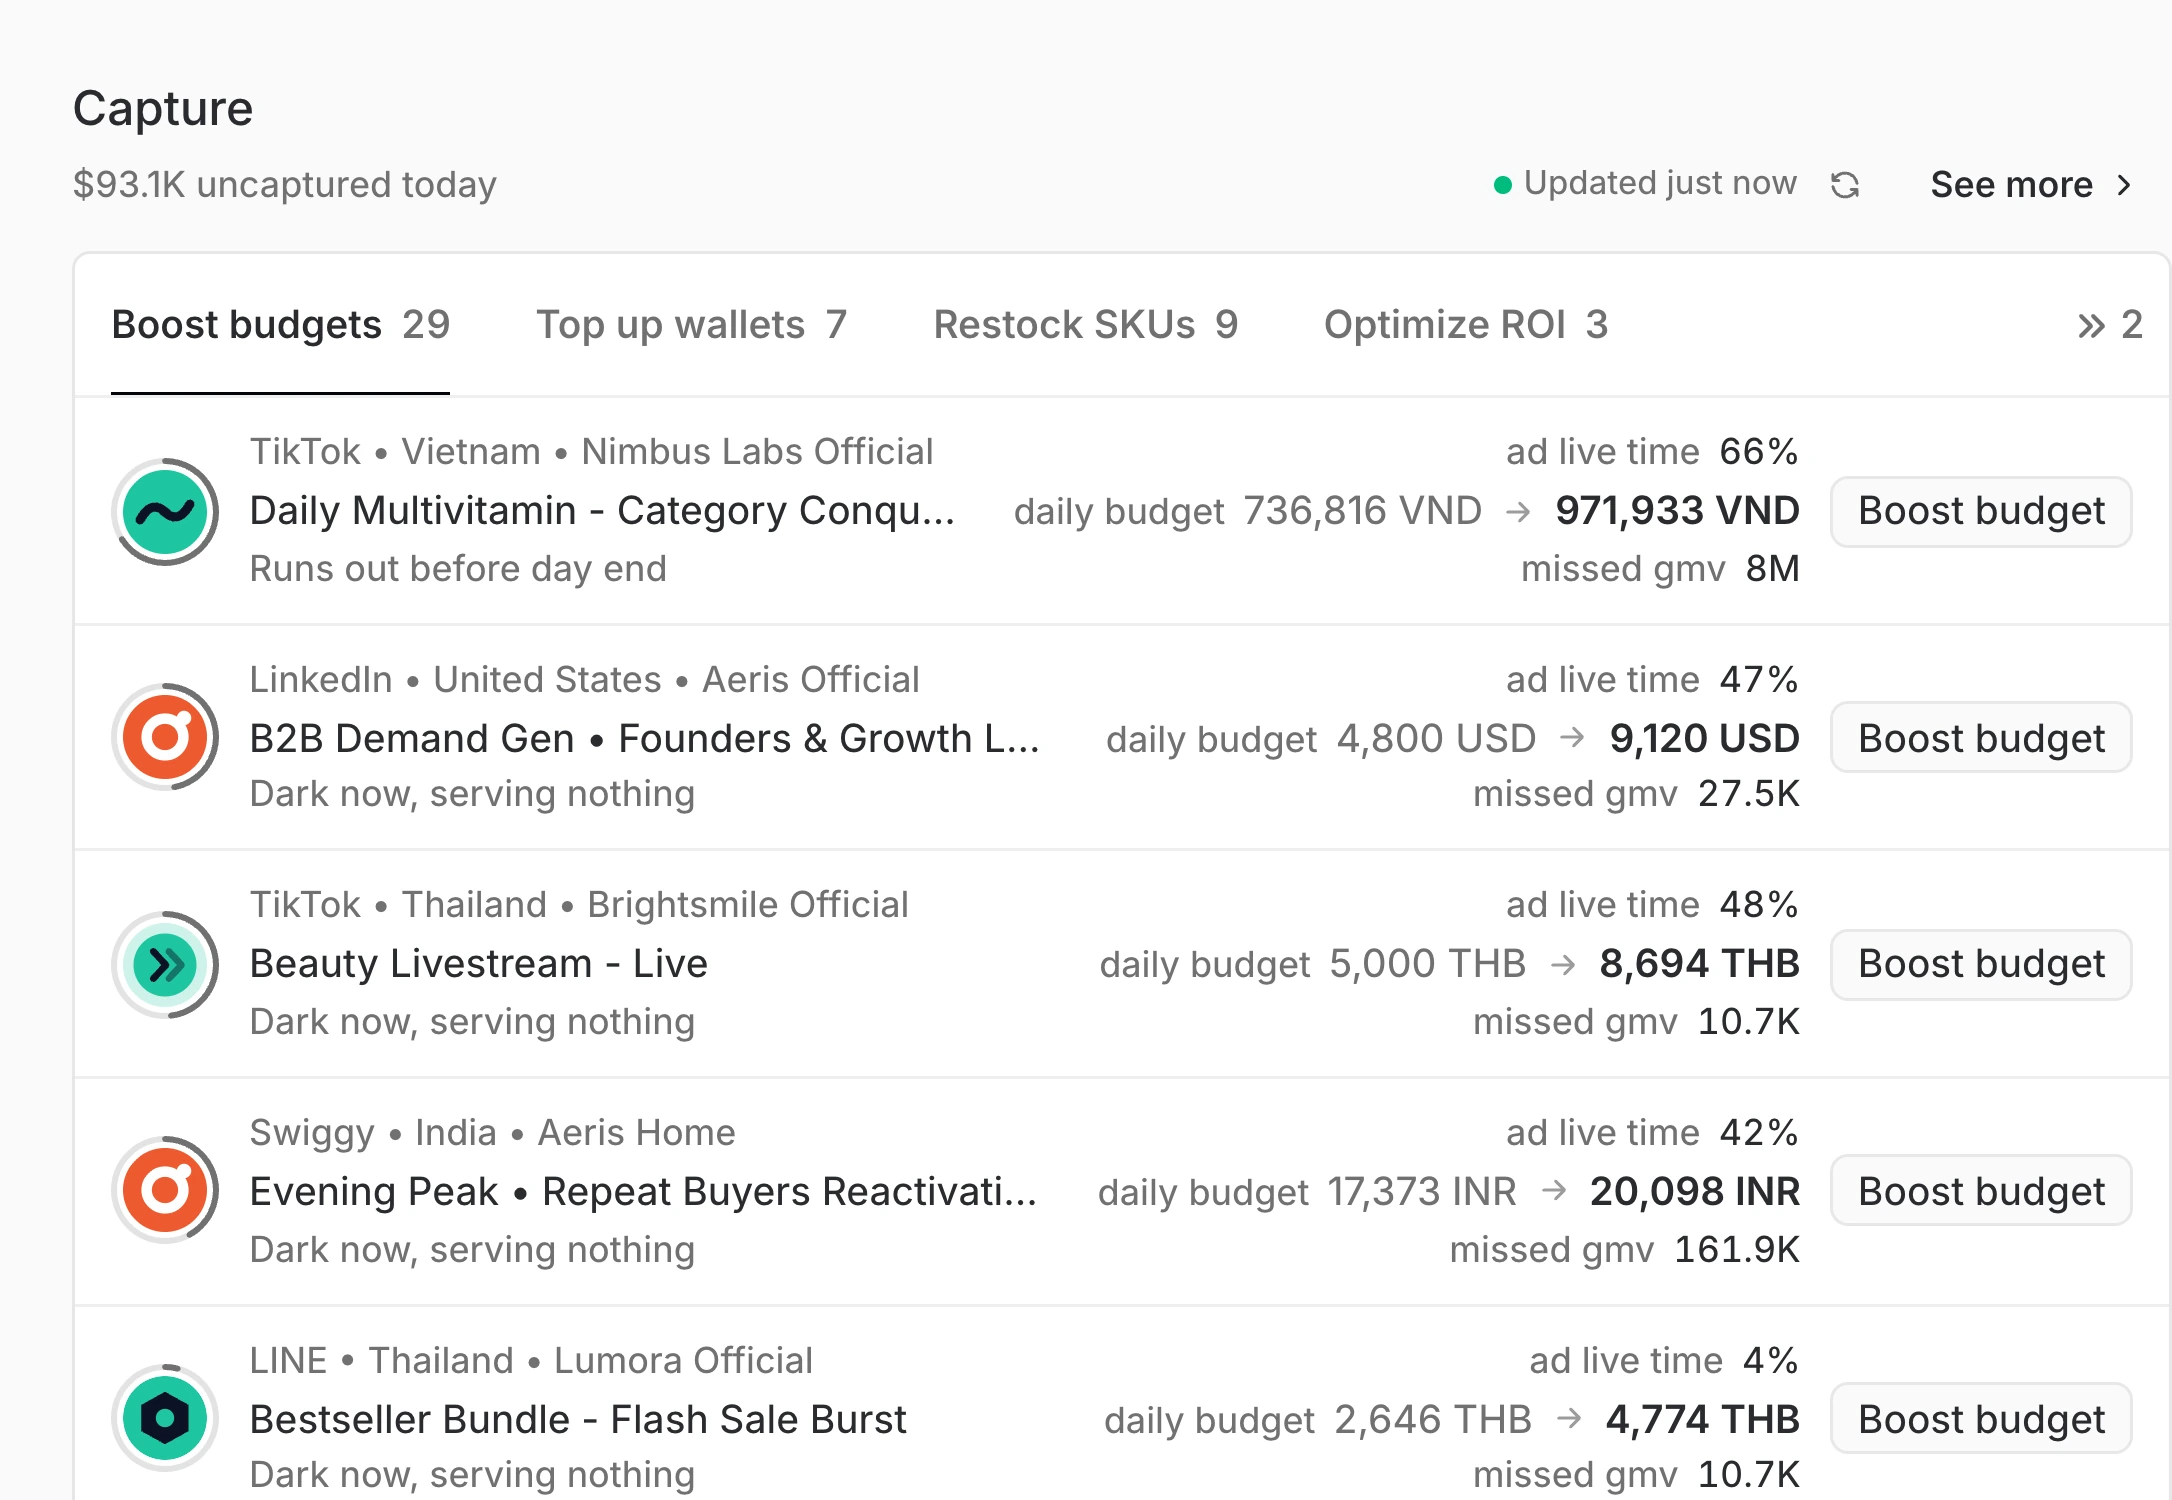
Ad uptime. Live ad uptime, the metric
every native agent is blind to.
Measures when ads run versus go dark across every network, surfacing wasted spend and recoverable impressions native agents cannot show.
Ad rank. Where you rank,
against whom, on every surface.
Maps where you appear and how you rank against the competitors you choose, on every keyword, chart, and feed you watch.

Spend pacing. Hold pacing,
redraw the curve live.
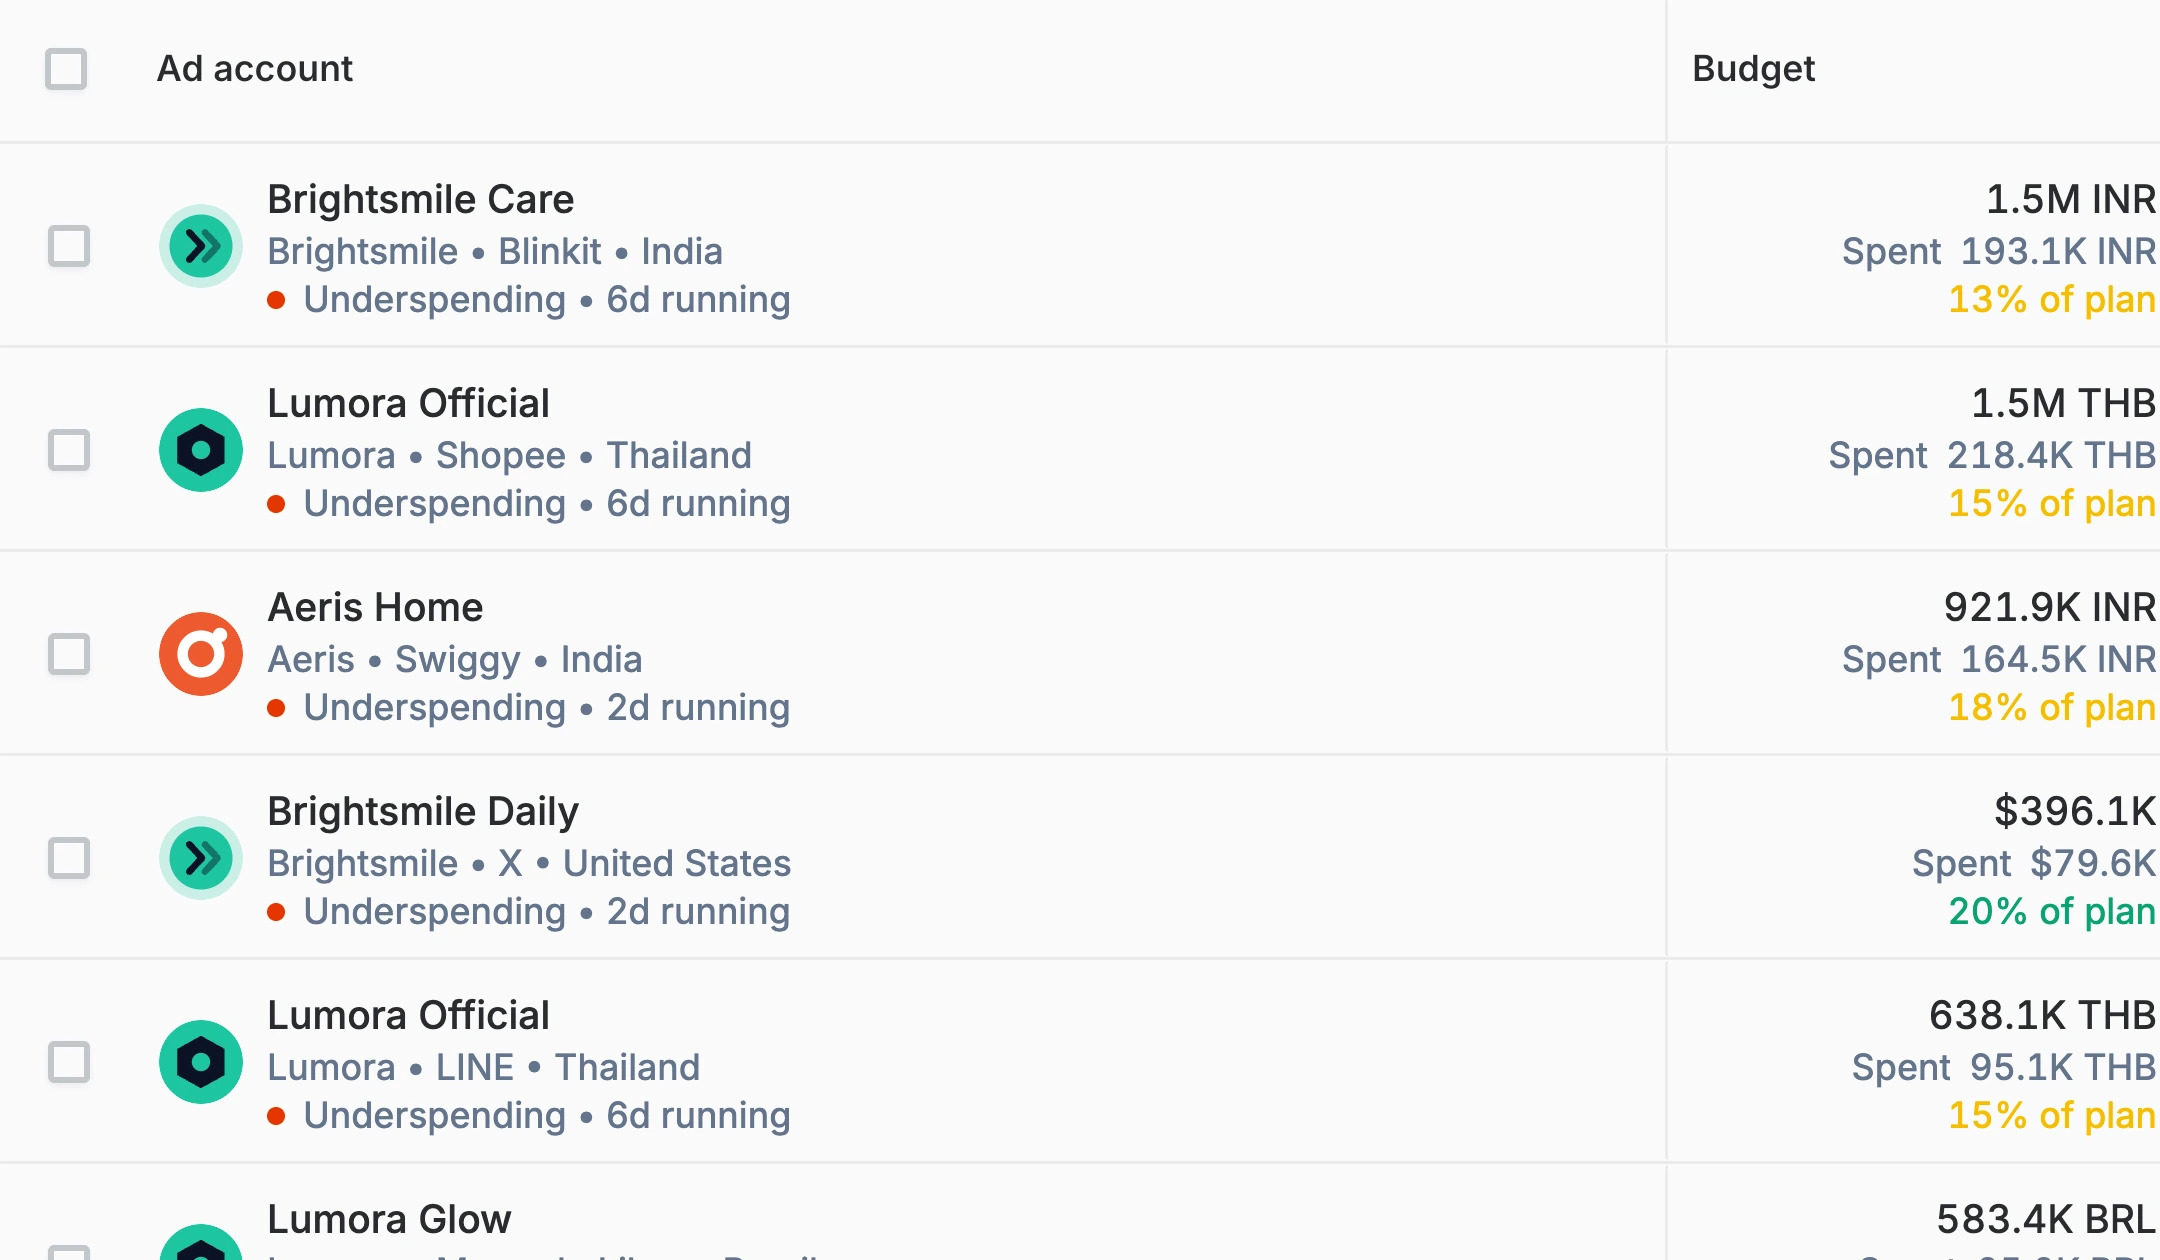
Projects ad outcomes against live spend pacing with what-if levers redrawn in real time for confident budget decisions.
Ad health. Why your ads
aren't performing, in one dashboard.
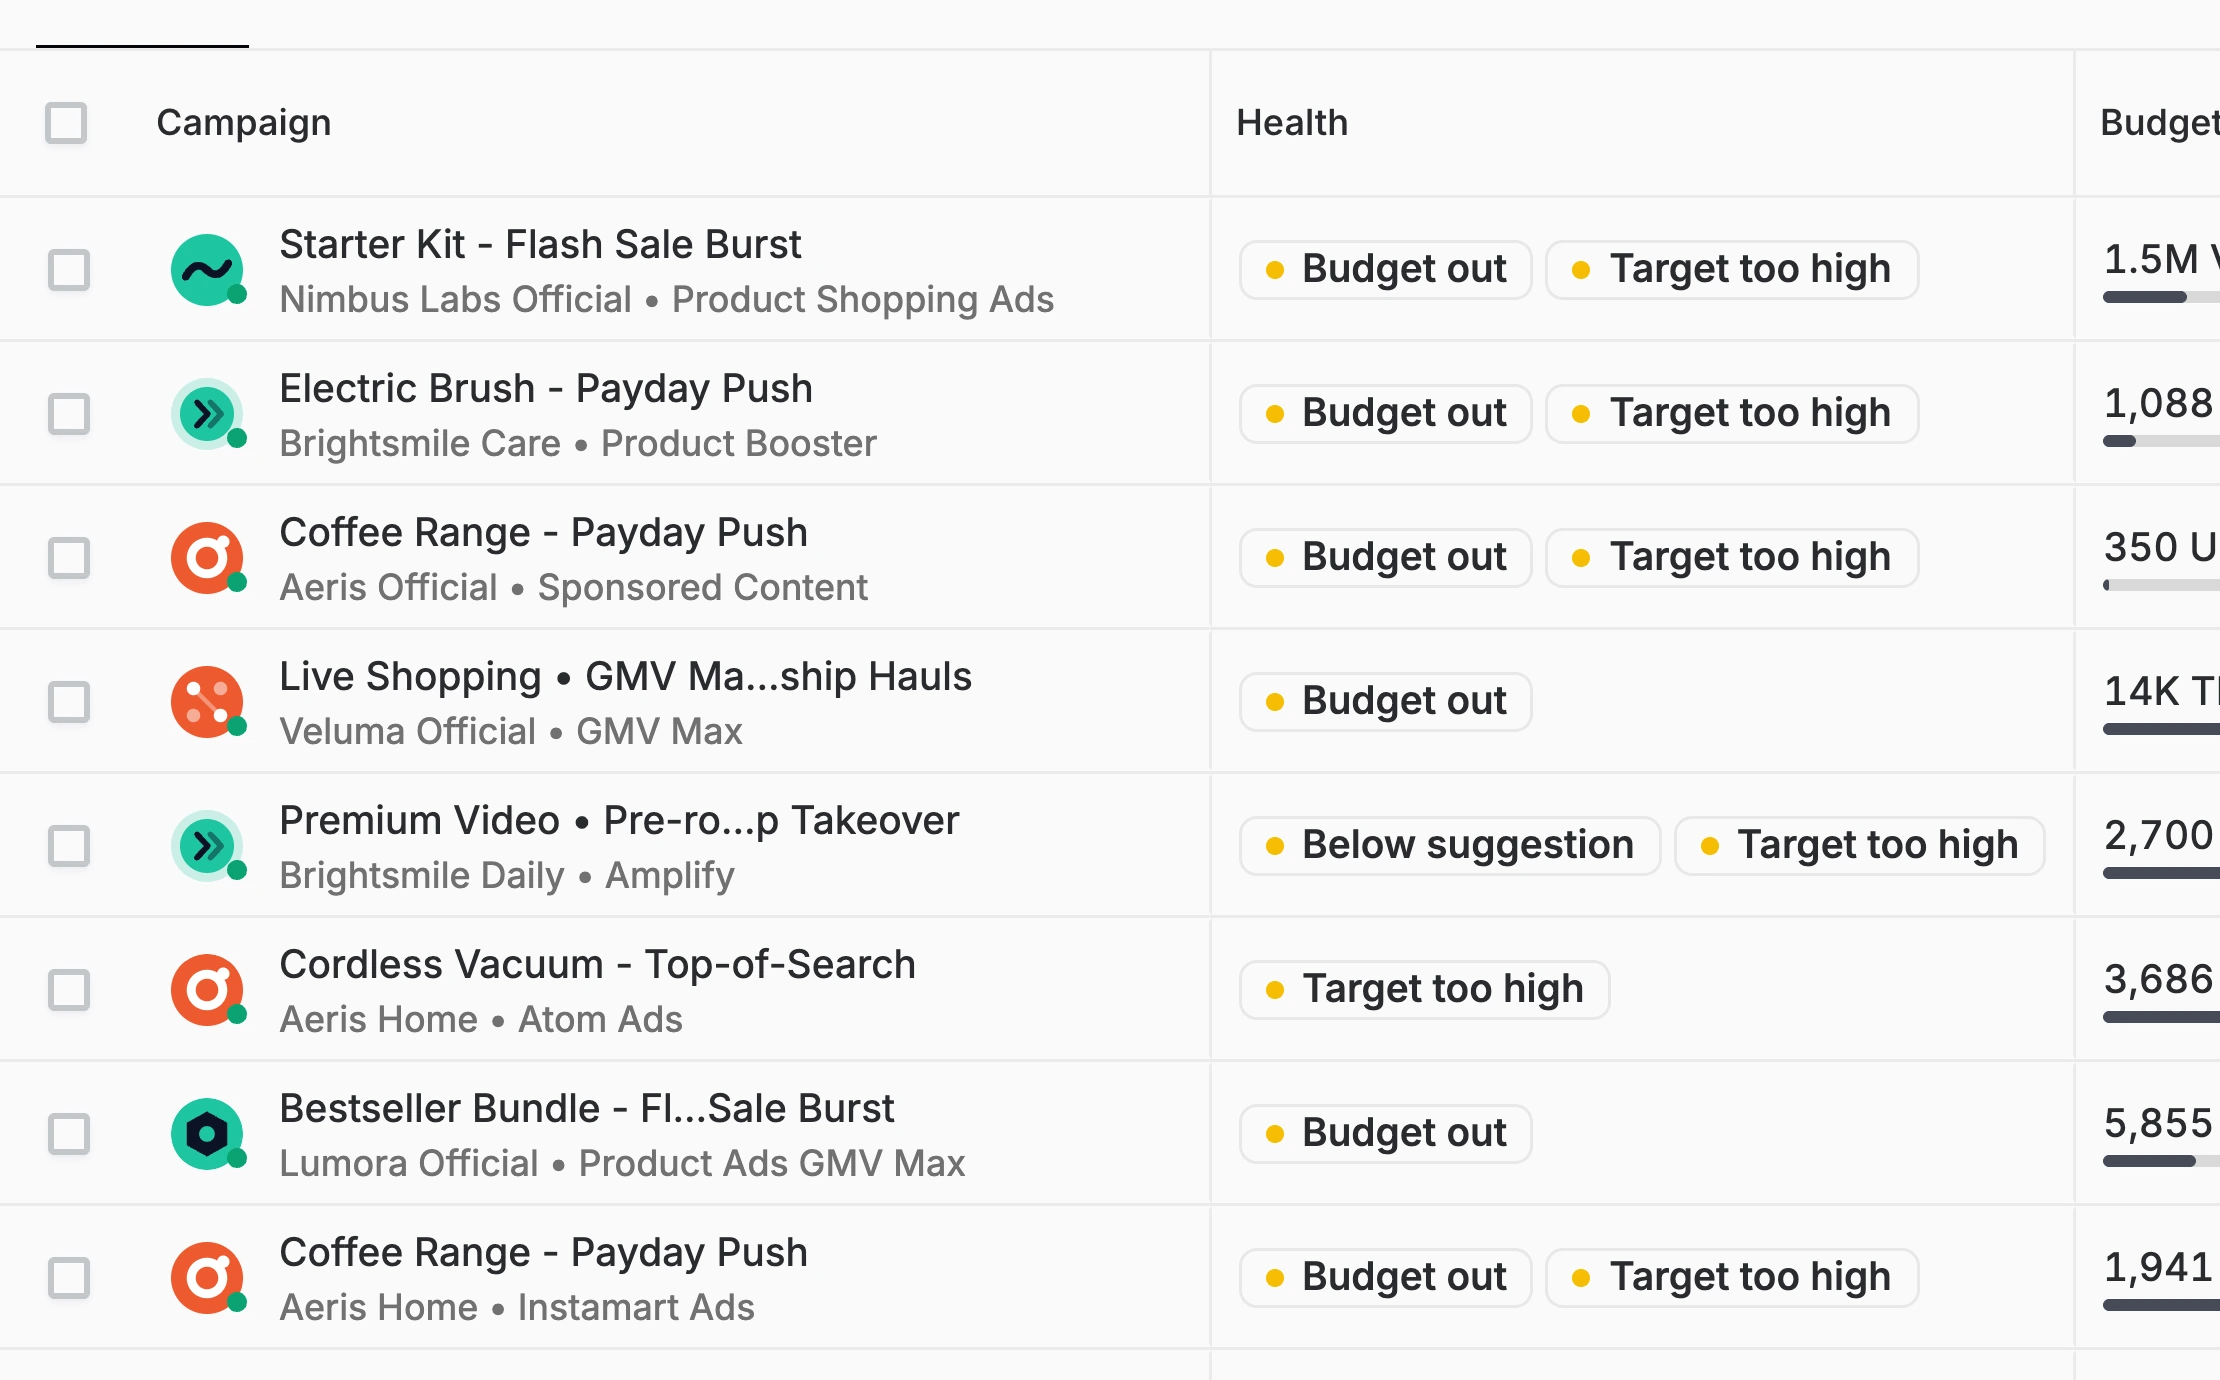
Surfaces diagnostic insights showing why ads underdeliver: performing time, auto-ads health (GMV Max, Performance Max, Smart+, UAC), auction and competition health, audience saturation, budget utilization, and creative freshness across every connected network.
Ad drift. What you lose
when ads aren't optimal.
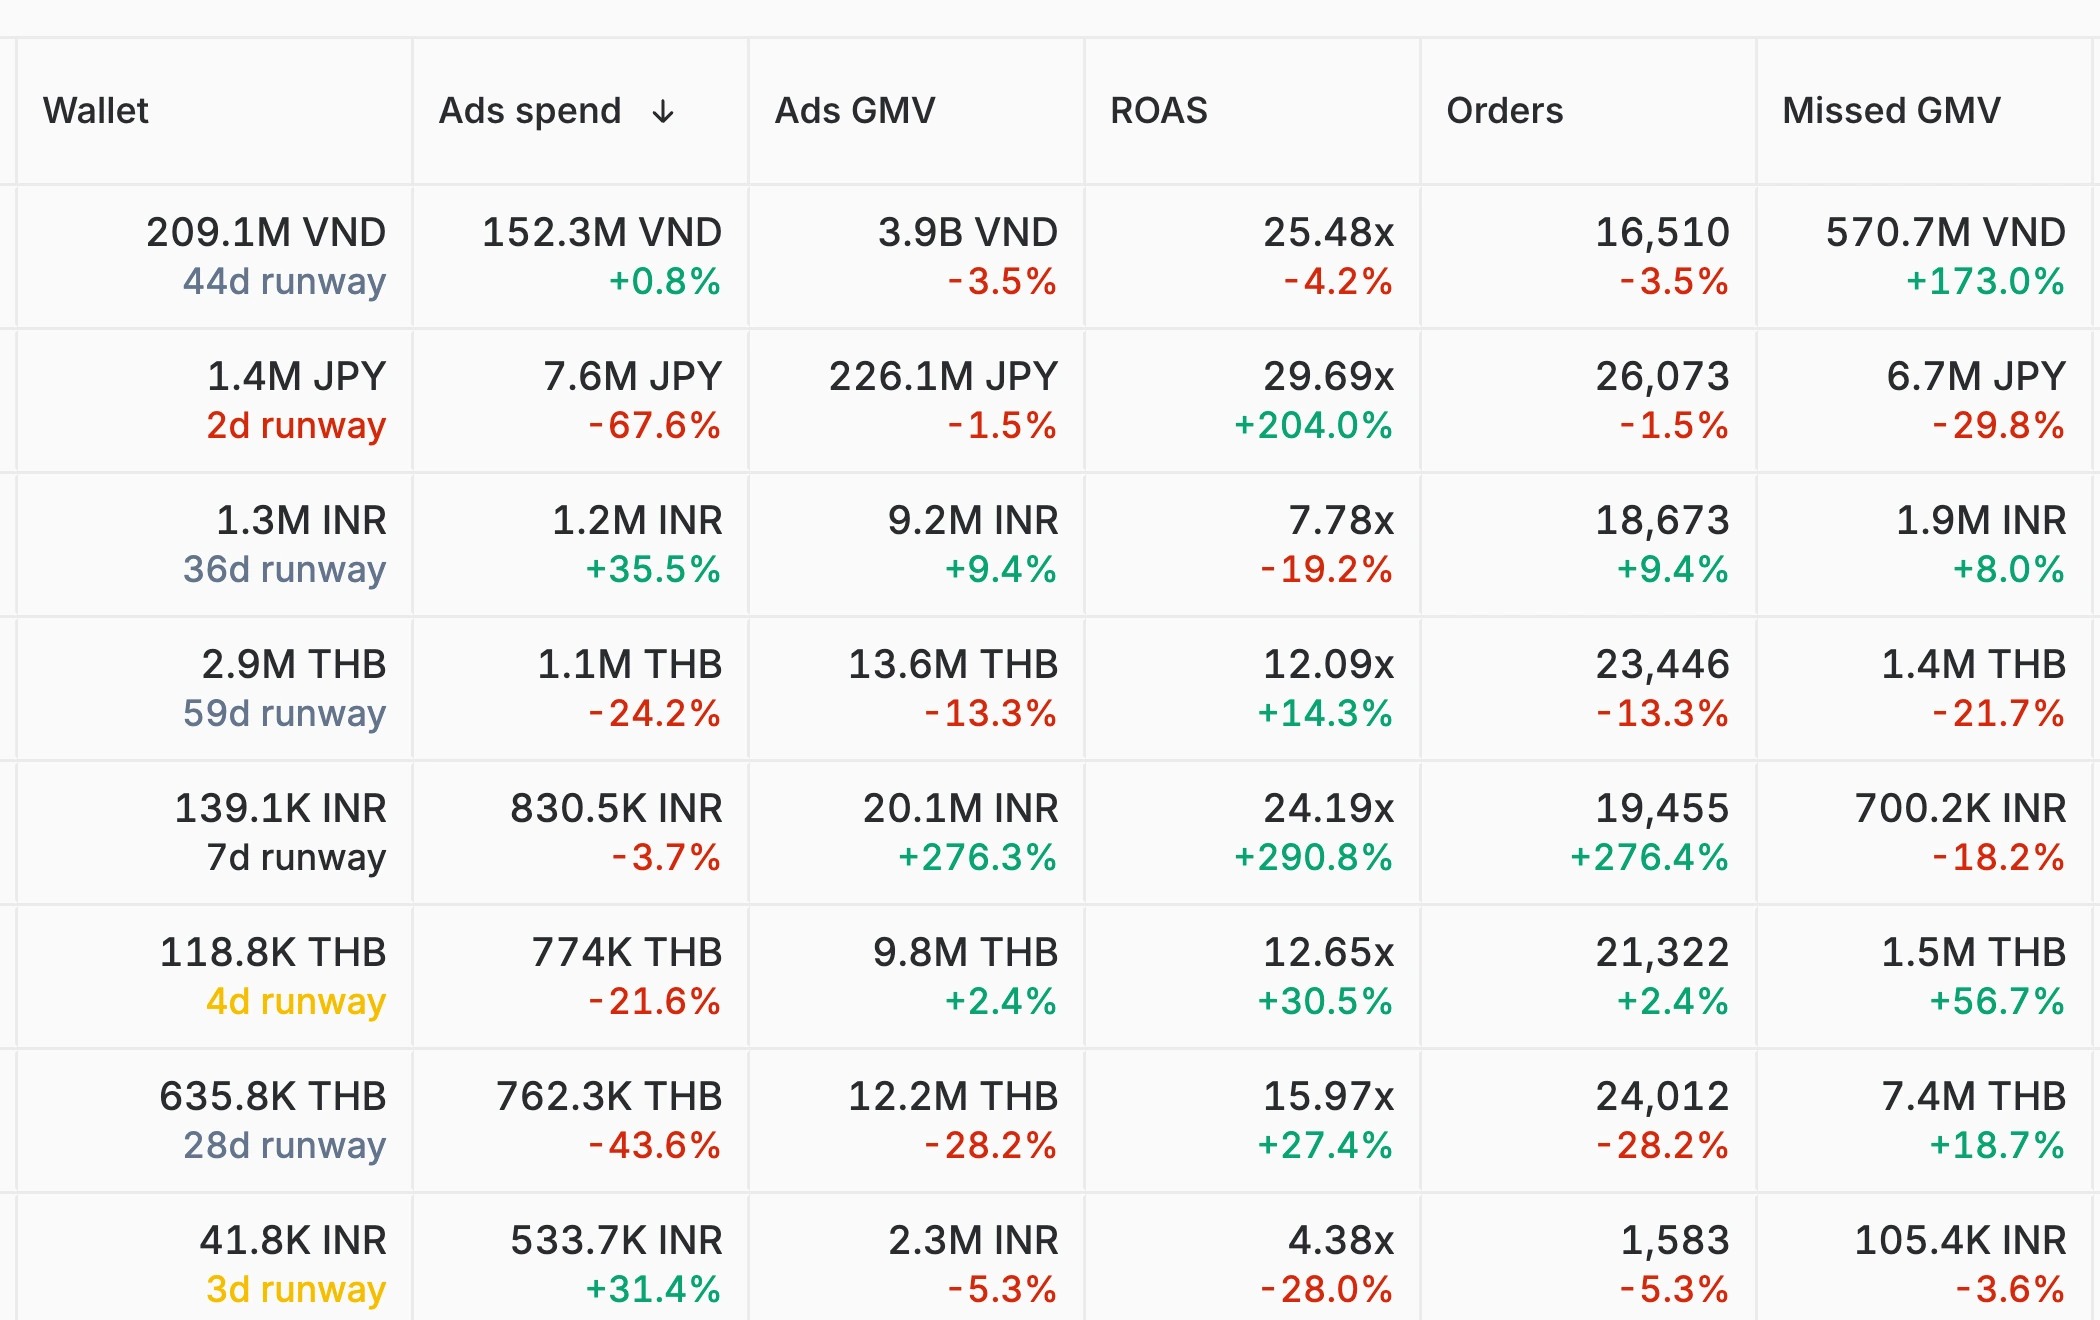
Quantifies ad waste in dollars, GMV loss from downtime, overspend on weak placements, pacing misses, bid drift, and benchmark underperformance, so teams see exactly what they're losing before it compounds.
Inside Ad uptime.
The live-time tracker every Benchmark surface reads from.
Ad live time
Per-second uptime tracking on every campaign, every network. The metric every other Benchmark surface reads from.